Why debug_mode Should Not Be Hardcoded in Production GA4 Tags
Leaving debug_mode or debug_event in a live GA4 tag floods DebugView with every visitor and can silently drop production data if the Developer Traffic filter is active. Google disables debug signaling by omitting these fields entirely — not by setting them to false.
The Short Version
If a live GA4 tag in Google Tag Manager includes the debug_mode or debug_event parameter — even set to false — every visitor on your site can be treated as a debug device. That has two consequences worth separating.
The first is immediate and predictable: DebugView floods. The device dropdown fills with thousands of unrelated user streams, and the view you rely on for QA stops being usable for actual development testing.
The second is conditional but serious: standard reports still include debug events by default, so your main reporting may look fine for a long time. But if anyone on your team goes to Admin → Data collection and modification → Data filters and activates the Developer Traffic filter, GA4 will permanently stop processing incoming traffic that carries debug mode. Google is explicit that excluded data is never processed and never becomes available in Analytics.
So the problem is not just debug_mode: true left on by accident. It is debug_mode or debug_event present at all on a tag that ships to production — because Google disables debug signaling by excluding the field entirely, not by setting it to false.
What debug_mode and debug_event Are For
debug_mode tells Google Analytics 4 to treat an event as debug traffic so it appears in DebugView in near real time. That is useful while you are installing tags, validating parameters, or stepping through a funnel on a device you control.
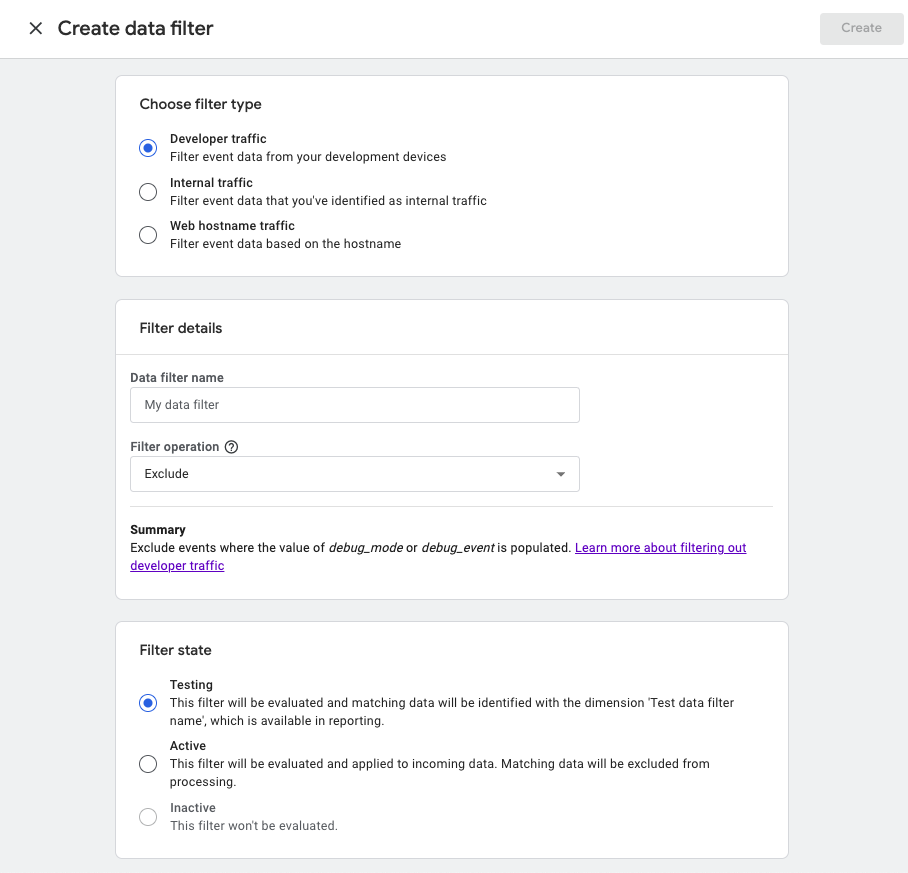
debug_event is less visible in Google's public documentation, but it behaves the same way for practical purposes: if the field is populated on a live hit, GA4 can treat that traffic as developer/debug traffic. The strongest on-the-record confirmation is not in the DebugView help article — it is in the Developer Traffic data-filter UI itself, which summarizes an exclude filter as:
"Exclude events where the value of debug_mode or debug_event is populated."
That wording appears when you create the filter in Admin → Data collection and modification → Data filters, even though the linked help page, Filter out developer traffic, only talks about "debug mode" generically and never mentions debug_event by name.
For audits, I treat the two parameters as synonyms: either one present on a production tag is worth flagging, and the fix always names the parameter that was actually found.
Google documents three practical ways to turn debug mode on for a website:
- Google Tag Assistant or GTM Preview mode for yourself — Tag Assistant adds a parameter to the page URL so only your session is in debug mode.
debug_mode: trueon the Google tag (gtag.js) — sends every event on the page to DebugView.debug_mode: trueon specific GA4 event tags in GTM — limits DebugView visibility to those events only.
Official reference: Monitor events in DebugView - Analytics Help
The third option is where containers often go wrong. It is a legitimate debugging technique when scoped carefully. It becomes a production problem when the parameter is saved into a published tag and never removed.
Why Presence Matters More Than the Value
This is the part that surprises people, and Google states it plainly in the same DebugView article.
For gtag.js:
"To disable debug mode, exclude the
'debug_mode'parameter; setting the parameter tofalsedoesn't disable debug mode."
For Google Tag Manager:
"To disable debug mode, exclude the
'debug_mode'field. Setting the field tofalsewon't disable debug mode."
Read that twice if you need to. debug_mode: false is not the off switch. The off switch is deleting the row entirely. The same presence rule applies to debug_event: the Developer Traffic filter UI treats a populated value as developer traffic, so a "false" string left in the export is not a safe production configuration either.
That matters in GTM because the GA4 tag UI makes it look like a normal boolean parameter. Someone copies a staging configuration, sets debug_mode to false before publish, and assumes production is safe. The export tells a different story:
{
  "key": "configSettingsTable",
  "list": [
    {
      "type": "MAP",
      "map": [
        { "key": "parameter", "value": "debug_mode" },
        { "key": "parameterValue", "value": "false" }
      ]
    }
  ]
}
That tag still carries debug_mode. It still qualifies as debug traffic. The value "false" is cosmetic from GA4's point of view.
The same trap applies when the value is a variable that resolves to boolean false, null, or even an empty string at runtime. If the parameter row exists in the tag or in a referenced Google Tag Configuration Settings (gtcs) or Google Analytics Event Settings (gtes) variable, the configuration is still "debug-capable" in a way that is easy to misread in the UI — unless the resolved value is a true JavaScript undefined, where typeof the value equals "undefined". In that case, GTM omits the key from the configuration object the GA4 client-side engine reads, which is the correct way to disable debug signaling.
What Happens on Live Production Traffic
DebugView flooding
When debug_mode or debug_event is present on a tag that fires for all users, GA4 treats those sessions as debug devices. DebugView is designed for a small number of development sessions you can pick out in the DEBUG DEVICE dropdown. Production traffic turns that dropdown into noise.
Nothing crashes. No GTM validation error appears. Your standard reports may still look normal. But the QA workflow breaks immediately: you can no longer reliably find your test device among everyone else's live sessions.
This is the impact you should expect every time debug_mode or debug_event ships on a live tag.
Reporting loss — only if the Developer Traffic filter is active
By default, debug events are not filtered out of standard GA4 reports. DebugView and reporting are separate surfaces. That is why this misconfiguration can survive unnoticed for months.
The risk changes the day someone enables Google's Developer Traffic data filter. That filter exists so teams can keep using DebugView while excluding developer sessions from reporting — a sensible idea when debug mode is limited to actual developers.
The filter-creation dialog is clearer about scope than the help article linked from it. In the UI, an exclude filter is summarized as dropping events where debug_mode or debug_event is populated. The help page, by contrast, only says that Analytics will filter out data collected "when debug mode is enabled" and never names debug_event at all.
Google's documentation for that filter is still worth reading carefully:
"Once you apply a data filter, the effect on the data is permanent. For example, if you apply an exclude data filter, the excluded data is never processed and will never be available in Analytics."
And when the filter is active:
"Google Analytics will filter out any data collected from users when debug mode is enabled."
Official references: Filter out developer traffic - Analytics Help, Data filters - Analytics Help
Combine those two facts with debug_mode or debug_event left on a production tag and the scenario is uncomfortable: every live user looks like a developer to GA4, and an active exclude filter permanently drops that traffic from processing. Historical data already collected stays, but new production data does not come back.
That is why I treat this as a two-part issue in audits: DebugView flooding is the guaranteed symptom; reporting loss is the conditional one that becomes severe if the filter is turned on.
Where This Hides in GTM
In a container export, debug_mode or debug_event usually appears in one of these places:
configSettingsTableon a Google tag (googtag) — applies broadly to events using that configuration.eventSettingsTableon a GA4 Event tag (gaawe) — applies only to that event.- A referenced
gtcsorgtesvariable — inherited by any tag pointing at that variable, which makes the problem harder to spot because the tag itself looks clean until you open the variable.
It can also survive container handoffs as a copied settings variable, a leftover row from a debugging sprint, or a well-intentioned false value someone added instead of deleting the parameter.
None of that is obvious from scanning tag names. You have to inspect parameter tables, including inherited settings.
Legitimate Ways to Debug Without Hardcoding debug_mode
You do not need a permanent debug_mode row to use DebugView. Most of the time, you should reach for a tool that limits debug signaling to your own session rather than baking a parameter into the published container.
For your own session (most common)
These options work well when you only need to see your own hits in DebugView:
- GTM Preview and Debug mode — GTM handles debug signaling while preview is open. You do not need a published
debug_modeparameter for that workflow. Preview mode applies only to you and to colleagues who open a shared preview link; it does not affect ordinary site visitors. - Google Tag Assistant at tagassistant.google.com — enables debug mode for your browser session via URL parameters, without changing the published container.
For a Chrome-only workflow
- The Google Analytics Debugger extension — toggles debug mode locally in your Chrome browser. Remember to turn it off when you are done. Like Preview mode, this affects only your browser, not production traffic at large.
These are the right defaults for day-to-day tag QA. They keep debug signaling out of the published container entirely.
When you need debug_mode in the tag configuration (rare)
There are uncommon cases where you want DebugView for a specific class of visitors — for example, people hitting a staging hostname, a test subdomain, or an internal QA environment — without enabling debug mode for everyone on production.
In those cases, wire debug_mode (or debug_event) to a Custom JavaScript variable or a lookup table that:
- returns a defined value such as
true,"1", or"true"when the visitor matches your staging or test criteria, and - returns
undefinedeverywhere else.
Sometimes the conditional logic lives on the backend server instead of in GTM. That is a valid pattern too: have the server push the effective debug value into the data layer, wire debug_mode in the tag to a Data Layer variable, and make sure production responses either omit the key entirely or leave it unset when debugging is not wanted. GTM simply passes through what the page already knows — but the server-side contract is only half the story. The Data Layer variable must actually resolve a missing key to JavaScript undefined, and that is not automatic: it depends on the variable's version and on whether its key name uses dot notation. Most inherited containers mix version 1 and version 2 Data Layer variables, and the two versions do not always read an omitted nested key the same way. Before you rely on this pattern in production, read Mixed Data Layer Variable Versions in GTM and confirm the variable you wired to debug_mode behaves as you expect when the debug signal is absent.
undefined is a primitive value in JavaScript. In this implementation, production traffic must omit the GA4 debug_mode parameter entirely. GA4 disables debug mode by excluding the debug_mode parameter — not by setting it to false. The conditional logic must account for that behavior, whether it runs in GTM or on the server.
Example pattern for a Custom JavaScript variable scoped to a staging hostname:
function() {
  var hostname = {{Page Hostname}};
  if (hostname === 'staging.example.com') {
    return true;
  }
  return undefined;
}
A lookup table can follow the same idea: map staging hostnames to true and leave the default row empty or set to undefined.
I have also seen containers where someone wired the parameter key itself through a variable or lookup table — for example, returning REM_debug_mode on production so the field name no longer matches what GA4 checks. That technically disables debug mode, but I do not recommend it. It makes the conditional logic harder for most humans (and LLMs) to follow during audits, and the undefined return pattern above is simpler to reason about.
The common thread: production tags should not hardcode debug_mode or debug_event. Personal debugging belongs in Preview mode, Tag Assistant, or a browser extension. Environment-scoped debugging belongs in conditional variables that return undefined on production — not in a literal true/false value that every visitor inherits.
How GTM Refine Surfaces This
Because GTM will happily save and publish a tag with debug_mode or debug_event set to false, this is a good fit for a deterministic audit check rather than eyeballing parameter tables.
GTM Refine scans active GA4 tags for any debug_mode or debug_event entry in eventSettingsTable or configSettingsTable, including values inherited from referenced gtes and gtcs variables. If either parameter is present anywhere in that chain, the tag is flagged — and the note names the parameter that was actually found.
Hardcoded literal values — including true, false, or a Constant variable that resolves to a fixed value — receive a direct recommendation to remove the parameter entirely. Values wired through other variable types, such as Custom JavaScript or lookup tables, are still flagged, with a softer prompt to review the conditional logic and confirm it returns undefined on production traffic so the field is omitted rather than populated.
The note explains both impact paths: DebugView flooding on live traffic, and the conditional reporting risk if the Developer Traffic filter is active. The suggested fix matches Google's own disable instruction: remove the parameter entirely, or restrict it to environments where you explicitly want DebugView traffic for development testing.
Audit Your Container
If you inherited a GA4 setup — or if your team added debug_mode or debug_event during a debugging session and never removed the row — the fastest way to know is to inspect the container export rather than opening every GA4 tag by hand.
Upload your container JSON to GTM Refine and run an audit. It flags active GA4 tags that include or inherit debug_mode or debug_event, including the easy-to-miss false cases and settings-variable inheritance paths. It has a generous free tier, so you can see whether either parameter is present before you change anything.
Removing debug_mode and debug_event from production tags will not make your reports more exciting. It will keep DebugView usable for the work it was meant for — and it will stop a quiet configuration mistake from turning into permanent data loss the day someone activates the Developer Traffic filter.